
How AI Is Changing Office Layout Decisions — Not Replacing Designers
Table of Contents
Most executives approve an office floor plan in under an hour. It arrives as a single drawing, it looks reasonable, the desk count matches the headcount, and it gets signed. Three years and several million pounds later, the same organisation is quietly working around that decision every day — booking meeting rooms that sit empty, pulling headphones on in zones designed for focus, and paying rent on square metres nobody uses.
The problem is not that leaders make careless decisions. It is that office layout productivity has almost never been something they could test before committing. You could review a plan. You could not simulate how three hundred people would actually move through it.
That is the part artificial intelligence is genuinely changing. Not the design. The evidence available at the moment of the decision.

The Real Problem: Most Layouts Are Approved From a Single Option
Ask a corporate leader how many layout options they reviewed before approving their current office. The usual answer is one, occasionally two variations of the same idea.
This is not a failure of ambition. Producing genuinely different floor plans by hand is slow and expensive. A design team can spend two weeks developing one option properly. Producing six, each tested against office circulation, adjacency planning, and daylight access, was historically not commercially viable. So the industry did what the economics allowed: it developed a single strong scheme and refined it.
The consequence is structural. When you approve from one option, you are not choosing. You are accepting. And you have no way of knowing whether the plan in front of you allocates space well or merely allocates it plausibly.
The Human Cost of a Layout Nobody Tested
People adapt to bad space silently, which is precisely why the cost stays invisible to leadership.
A finance team placed on the main circulation route does not file a complaint. They put on headphones. Two departments that collaborate daily but sit on opposite ends of a floor plate do not escalate it. They send more emails and meet less often. Staff who cannot find a free room for a private conversation do not report a shortage of rooms. They take the call in a stairwell.
None of this appears in a report. It appears as slightly slower decisions, slightly weaker collaboration, and slightly higher attrition — outcomes that get attributed to management, culture, or market conditions long before anyone suspects the floor plan.
This is the Human Factor that sits underneath every office layout productivity conversation. Space either supports how people actually work, or it quietly taxes them for years — and that tax is exactly what workplace performance measures.
Office Layout Productivity Is a Spatial Logic Problem, Not a Furniture Problem
There is a persistent assumption that workplace performance is a matter of specification — better chairs, better lighting, better finishes. Those things matter, but they are downstream.
Office layout productivity is determined by decisions made much earlier: how the floor plate is zoned, which functions sit adjacent to which, how circulation is routed, where acoustic separation is established, and how meeting supply is matched to actual demand. Get those right and modest finishes perform well. Get them wrong and no amount of specification recovers the loss. Workplace performance is set at the plan stage, not the procurement stage.
Three variables carry most of the weight:
Zoning. Office zoning is where office space utilization is won or lost. Focus work, collaborative work, and social or transitional space have incompatible requirements. Office zoning that separates them by acoustic and visual logic — rather than by whatever floor area happened to be left over — is the single highest-leverage layout decision available.
Adjacency. Teams that exchange information constantly should be within sight of each other. Teams that do not should not be competing for the same corridor. Office zoning by adjacency is usually decided by organisational hierarchy rather than by information flow, which is why so many floor plates look like org charts rather than workplaces.
Circulation. Office circulation determines how much of a floor plate is genuinely usable. Inefficient routing consumes area, creates noise where it is least wanted, and generates the interruptions that make focus work impossible in open plan environments.
Comet’s work on acoustic separation and focus zones in open-plan offices consistently shows the same pattern: the complaints attributed to open plan as a concept are usually complaints about office zoning executed without evidence.
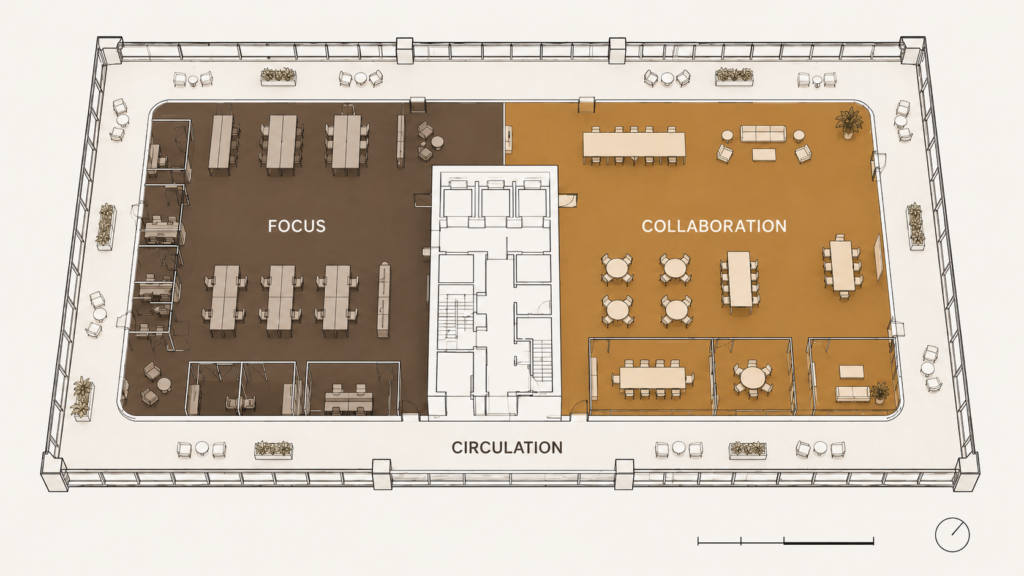
[Insert Image — Alt text: office zoning diagram separating focus, collaboration and circulation]
What AI Actually Does in Workplace Design
Here the conversation usually becomes unhelpful, because “AI in design” is marketed as though it produces finished buildings. It does not. What it does is remove specific constraints that previously limited how much evidence a decision could rest on.
It makes multiple layout options economically viable
Generative layout options are the clearest shift. Given a floor plate, a set of rules — circulation widths, daylight requirements, department sizes, adjacency priorities — and a set of constraints, generative tools can produce and evaluate dozens of configurations rapidly. Autodesk’s generative design tooling is the most widely documented example of this approach in practice.
The output is not a design. Most generated options are unusable, and the tool has no view on whether any of them is appropriate. What changes is that scenario testing becomes affordable. Instead of defending one scheme, a design team can demonstrate why the recommended scheme outperforms eleven alternatives on measurable criteria. That is a fundamentally different conversation to have with a board.
It replaces assumed headcount with observed occupancy data
The second shift is data. Badge and sensor data, room booking records, and Wi-Fi association logs describe how an existing workplace is actually used — desk utilization rate by zone and hour, meeting room occupancy against booking, dwell time in collaborative areas.
Office space utilization data is the clearest example, and the findings are routinely uncomfortable. Organisations discover that peak occupancy never approaches the headcount their space programming assumed, that large meeting rooms are consistently booked for two-person conversations, and that the rooms people genuinely need are the small ones nobody built. Hybrid office design built around occupancy data exists precisely because those patterns are so consistent across organisations.
Occupancy data does not tell you what to build. It tells you which of your assumptions were wrong — which is the more valuable input at the start of a project. This is the foundation of data driven workplace design: decisions calibrated to observed behaviour rather than to headcount forecasts.
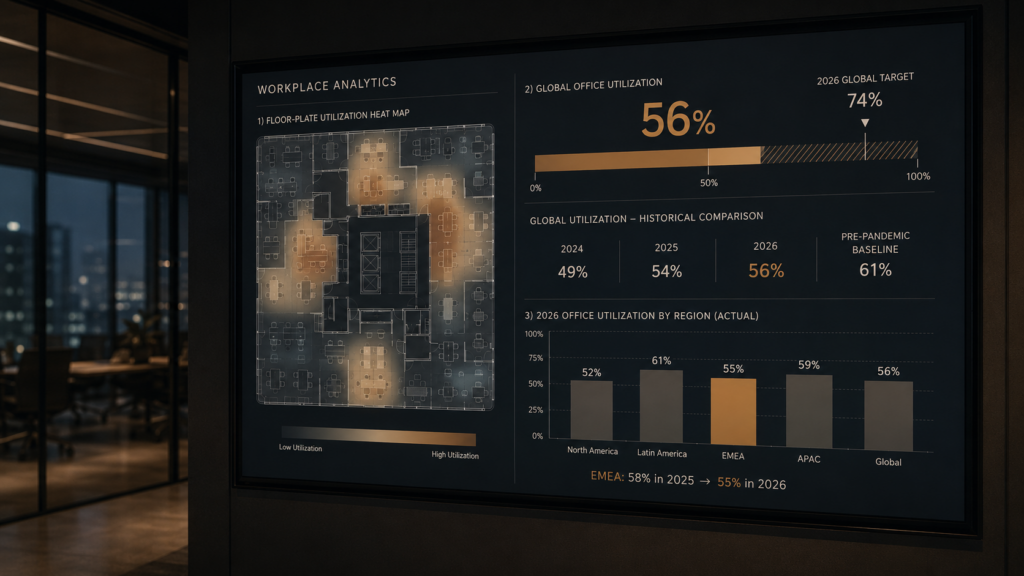
[Insert Image — Alt text: occupancy data dashboard informing workplace space programming]
It catches coordination failures before they become variation orders
The third shift is less discussed and financially significant. BIM-linked clash detection and automated documentation checking identify conflicts between architectural, structural, and MEP systems during design rather than on site.
A clash found in a model costs a revision. The same clash found during fit-out costs a variation order, a programme delay, and often a compromise to the layout that quietly undoes an office zoning decision made months earlier. This is where technology planned into the workplace from the start protects office layout productivity most directly — by preventing site conditions from eroding the design intent.
Where AI Stops — and Why Designers Still Decide
Everything above describes analysis. None of it describes judgement, and the distinction is where most AI-in-design claims fall apart.
An algorithm optimises against the constraints it is given. It cannot tell you which constraints are the right ones. It does not know that a company is about to restructure two departments, that the founder’s decision-making style requires informal visibility across the floor, that a particular team is fragile after a difficult year and should not be moved twice, or that the organisation’s stated culture and its actual culture are different things.
Nor can it read a room. Occupancy data tells you a zone is underused. It does not tell you whether that is because the space is badly located, badly lit, socially claimed by one team, or simply new. The interpretation is human work, and getting it wrong produces a confidently data driven workplace design decision that makes the workplace worse.
Generative tools also optimise toward what is measurable, which systematically undervalues what is not. Generosity, calm, arrival sequence, the quality of a view — these carry real weight in how a workplace is experienced and effectively none in an optimisation model.
The honest framing is this: AI has substantially improved the inputs to workplace design decisions. It has not touched the judgement required to weigh those inputs against a specific organisation’s reality. Designers are not being replaced. They are being asked to defend their reasoning with evidence they did not previously have — which is a higher standard, not a lower one.
The Business Case: Cost Per Productive Square Metre
For a C-level reader, the relevant metric is not cost per square metre. It is cost per productive square metre.
A floor plate leased at a competitive rate but zoned badly is more expensive than a costlier one that works, because the difference shows up in the same P&L for the full term of the lease. Gensler’s global workplace research has consistently found that workplace effectiveness correlates with how well space supports the actual balance of focus and collaborative work — not with density or cost per head. JLL’s occupancy research quantifies the cost of getting it wrong.
Global office utilization reached 56% in 2026, up from 54% in 2025 and 49% in 2024, but still short of the pre-pandemic 61%. Put plainly, close to half of leased corporate floor area is paid for and structurally underused. That is what weak office space utilization looks like on a balance sheet.
Three financial consequences follow from evidence-led office layout productivity decisions:
Fewer fit-out variation orders. Coordination failures resolved in the model do not become site instructions. This is the most immediately measurable saving.
Space matched to demand rather than to forecast. Hybrid office design makes this sharper still, because attendance is variable rather than fixed. Space programming built on occupancy data rather than headcount projections avoids both over-leasing and the more expensive error of committing to a configuration that cannot flex.
There is one encouraging signal: the gap between actual and target utilization narrowed for the first time since tracking began, from 25 percentage points in 2024 and 2025 to 18 points in 2026 — driven partly by organisations setting more realistic targets rather than by space alone improving.
A defensible lease renewal business case. When leadership can show that space allocation was tested against measured utilization, capital requests stop being aesthetic arguments and become operational ones. Post occupancy evaluation then closes the loop, confirming whether the decision performed as modelled.
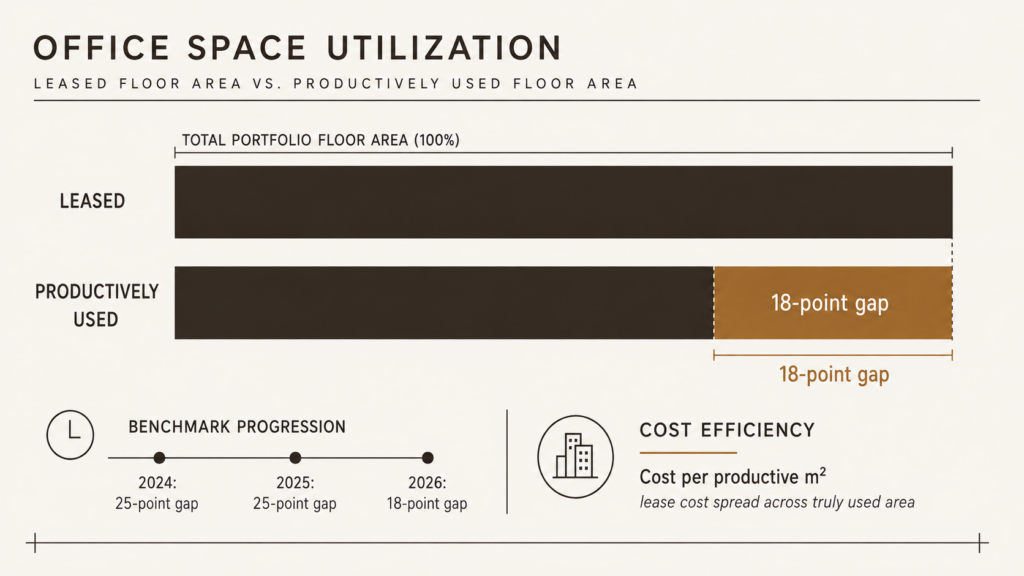
[Insert Image — Alt text: cost per productive square metre analysis for a corporate workplace]
Office Layout Productivity Across the MENA Market
The MENA context adds pressure that global workplace research does not fully capture, and the regional data makes that concrete. While office utilization rose in every other global region between 2023 and 2026, EMEA moved the other way — declining from 58% to 55%. It is the only region going backwards. For leaders in Cairo, Dubai and Riyadh, that means the regional baseline is drifting away from the global one, and imported assumptions are getting less reliable rather than more.
Corporate relocation is happening at unusual density. In Egypt, moves to New Cairo, the New Administrative Capital, and Sheikh Zayed have shifted a substantial share of organisations into new floor plates within a compressed period. In the UAE, free-zone consolidation and the steady migration of regional headquarters into Dubai and Abu Dhabi produce the same effect. In Saudi Arabia, the regional headquarters programme has pulled multinational offices into Riyadh on compressed timelines. These are one-time decisions with long consequences: a company committing to a new headquarters is fixing its zoning, adjacency, and capacity assumptions for the better part of a decade, frequently while also absorbing organisational change.
Two regional factors sharpen the stakes. Fit-out cost volatility means variation orders carry more risk here than in more stable markets — a coordination failure discovered on site is not just a delay but an exposure to changed pricing, and this is felt most acutely in Egypt. And hybrid office design has settled unevenly across MENA corporates, with attendance patterns varying widely by market, by sector, and by leadership preference. Gulf offices have generally returned to higher in-person attendance than European or North American benchmarks would predict, while Egyptian corporates remain more mixed. Designing to an imported attendance assumption is therefore substantially riskier here than applying it in the market it came from.
This is the strongest regional argument for data driven workplace design. Across MENA, relocation decisions are large, infrequent, and expensive to correct — so the value of testing office layout productivity before committing to it is proportionally higher, not lower, than in markets where space is easier to change. It also means workplace performance benchmarks borrowed wholesale from Gensler or JLL global datasets need local calibration before they drive a capital decision.
The Comet Approach
Comet sequences these projects deliberately, and the order matters more than the tooling.
We begin with observation rather than drawing: how the current workplace is actually used, where the friction sits, and which assumptions in the existing space programming are already failing. Where occupancy data exists, we use it. Where it does not, structured observation and interviews substitute for it. For hybrid office design in particular, this observation period matters more than any benchmark, because attendance patterns are organisation-specific.
Only then does data driven workplace design begin in earnest, and we generate options — multiple genuinely different configurations, tested against office circulation efficiency, adjacency priorities, acoustic requirements, and floor plate efficiency. The purpose is not to find a mathematically optimal plan. It is to understand the trade-offs well enough to recommend one with reasoning attached.
The recommendation itself is human, and it accounts for things no model contains: the organisation’s direction, its culture, its tolerance for change, and the way its leadership actually works. That judgement is the service. The analysis simply makes it accountable.
A Diagnostic Checklist for Leadership
Eight questions worth asking before approving any workplace layout:
- How many genuinely different layout options were produced — not variations of one scheme?
- What office space utilization evidence supports the assumed headcount and attendance pattern?
- What is our actual peak occupancy, and how does it compare to our desk count?
- Which meeting room sizes are booked most often, and does the plan reflect that hybrid office design reality?
- Which teams exchange information daily, and are they adjacent in this plan?
- Does office zoning keep circulation out of areas intended for focus work?
- What has been coordinated across architectural, structural, and MEP systems — and what has not?
- How will we evaluate workplace performance twelve months after occupation?
If most of these cannot be answered with evidence, the layout has not been tested. It has been drawn.

[Insert Image — Alt text: leadership reviewing office layout productivity options before approval]
Designing Layouts That Can Be Defended
AI has not made designers less necessary. It has made undefended design decisions harder to justify — which is a good outcome for anyone signing off on a workplace.
The organisations getting the most from data driven workplace design are not the ones buying the most technology. They are the ones insisting that layout decisions arrive with evidence attached, and that office layout productivity is treated as a business metric rather than a design preference.
If you are planning a relocation, a fit-out, or a workplace restructure, the decisions that will determine performance are made early — before the first drawing is approved.
Talk to Comet about your workplace →
Frequently Asked Questions
How does office layout affect productivity?
Layout determines how easily people can do focused work, how often the right people interact, and how much time is lost to friction like hunting for meeting space. Zoning, adjacency, and circulation carry most of this effect — which is why office layout productivity is decided long before furniture is selected.
Can AI actually improve office layout productivity, or is it just visualisation?
It does more than visualise. AI-assisted tools generate and evaluate many layout configurations against defined constraints, analyse occupancy data to replace assumed headcount with observed demand, and detect coordination clashes before construction. What they do not do is decide which option is right for a specific organisation.
What data do you need before redesigning an office layout?
At minimum: office space utilization by zone at peak and average, meeting room booking against actual attendance, desk utilization rate, and a clear map of which teams genuinely need proximity. Where sensor data is unavailable, structured observation over several weeks is a workable substitute.
How much office space is typically wasted in MENA corporate offices?
Precise regional benchmarks are limited, but global occupancy research consistently finds a substantial gap between leased area and productively used area. Across MENA this is often amplified by rapid relocation decisions in Cairo, Dubai and Riyadh, and by hybrid office design patterns that differ from the Western datasets most workplace performance benchmarks are built on.
Does AI replace the architect in workplace design?
No. It changes what architects can test and prove, not what they decide. Setting the right constraints, interpreting why a space underperforms, and weighing measurable efficiency against experience are judgement tasks that remain entirely human. See our workplace design guidance and our overview of trends redefining workplace design for related reading, including how these decisions differ when designing for a multi-generational workforce.